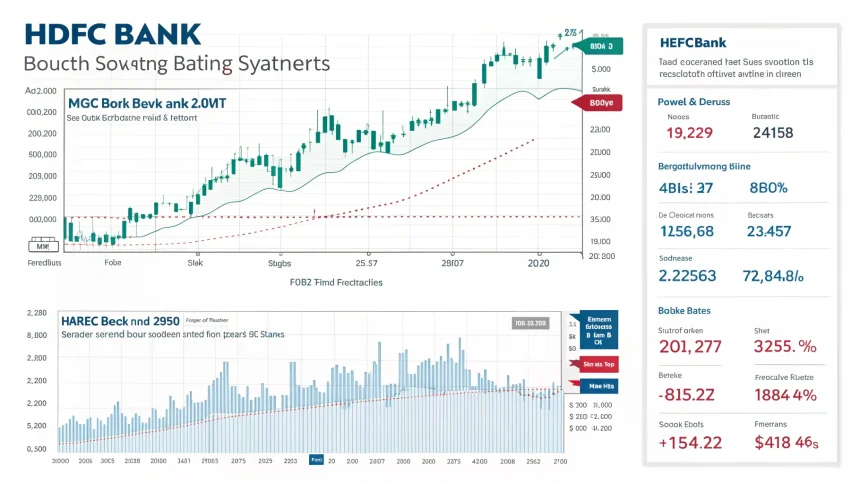
A fresh technical signal on HDFC Bank is drawing trader interest after a bruising stretch for India’s largest private-sector lender by market value. Technical analyst Ruchit Jayantilal Jain says the stock has formed a double bottom near recent swing lows and could rally to Rs 1,050 in the coming weeks.
The view arrives as investors weigh mixed cues in banking. Slower loan growth in some segments, margin pressure after deposit repricing, and the after-effects of last year’s merger with Housing Development Finance Corporation have kept the stock volatile. The new setup offers a clear trading plan for short-term participants.
Technical setup: a potential reversal pattern
“HDFC Bank stock price has recently formed a ‘Double Bottom’ pattern around the recent swing lows. Traders can buy for a target of Rs 1050 in the next few weeks,” said Ruchit Jayantilal Jain, VP, Head – Equity Technical Research at Motilal Oswal Financial Services.
A double bottom often signals that sellers are losing control after two failed attempts to push the price lower. The pattern is watched for confirmation when price moves above the neckline formed between the two lows. Volumes and follow-through help validate the move.
Jain’s call points to a defined target, giving traders a near-term roadmap. The zone around the recent lows acts as support, while the neckline breakout, if sustained, could open room toward Rs 1,050.
Why this matters now
HDFC Bank has been under scrutiny since the 2023 merger with HDFC Ltd, which expanded its balance sheet and changed key ratios. Investors have tracked deposit growth, cost of funds, and net interest margins as the merged entity settles. Any sign of technical strength can attract short-term flows and improve sentiment.
Broader market factors also shape the setup. Policy signals from the Reserve Bank of India, liquidity conditions, and movement in government bond yields influence bank stocks. In periods of rate stability, traders often lean on chart patterns to time entries and exits.
What the chart could imply for the street
If the pattern plays out, a move to Rs 1,050 would mark a relief rally from recent lows and may draw momentum traders. It could also ease concerns that the stock was stuck in a downtrend, at least in the short term.
For longer-horizon investors, the signal is only one piece of the puzzle. Earnings quality, fee income traction, and asset quality trends remain central. A technical rebound does not change the need to monitor quarterly results and guidance.
Risks and counterviews
Pattern failures are common when news flow turns adverse or when volumes do not support breakouts. Banks are sensitive to regulatory updates, rating changes, and macro data. A sudden spike in funding costs or weaker-than-expected credit growth could negate the setup.
Some market participants prefer to wait for confirmation. That could mean a daily or weekly close above the neckline, supported by rising volumes and relative strength against sector peers. Until then, they see the move as a tradable bounce rather than a trend change.
- Watch for a confirmed breakout above the neckline on strong volume.
- Track deposit growth and margin commentary in upcoming updates.
- Set stop-loss levels near recent lows to manage risk.
Sector backdrop and recent trends
Private banks have faced higher deposit costs as savers demand better rates. This has pressured margins even as credit demand holds in retail and select corporate pockets. The merger enlarged HDFC Bank’s loan book and customer base, but also brought integration tasks and shifts in product mix.
Analysts widely watch metrics such as net interest margin, cost-to-income ratio, and credit costs. Stable asset quality and steady fee income can support a rerating, while slippage or slower growth could keep valuations capped.
What to watch next
Traders will look for sustained price action above key resistance levels and a pickup in volume. Any positive management commentary on deposits and margins could reinforce the move. On the flip side, weaker sector prints or cautious guidance could stall momentum.
Jain’s target gives the market a near-term anchor. If the price approaches Rs 1,050 with improving breadth, it may draw fresh interest. If not, the pattern risks turning into another failed bounce.
For now, the signal adds a dose of optimism at a time when many remain cautious. The coming weeks will test whether the double bottom is a launchpad for recovery or just a pause in a choppy range.


